

September 2025 Monthly Index Returns
Each month, our Chief Investment Strategist, Eric Stein, and the East Bay Investment Solutions team share a market snapshot highlighting major index performance. It’s a quick, insightful view of global markets—a helpful pulse check we thought you’d also find valuable. Here are a few highlights from the latest report.
In stocks (equities):
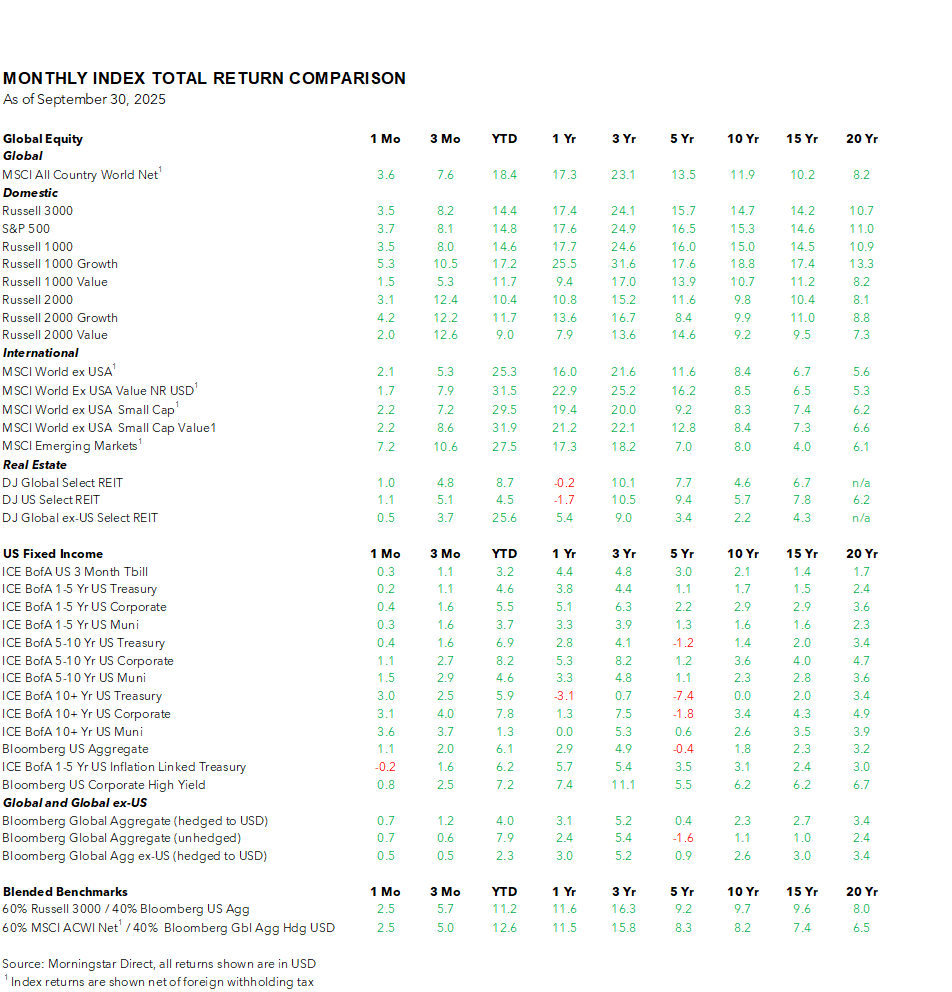
- Emerging markets stocks as measured by the MSCI Emerging Markets index were up +7.2% last month, which was the highest return among all regional stock asset classes, and are now up +27.5% on the year. By comparison, the S&P 500 index returned +3.7% last month and is up +14.8% on the year.
- The U.S. stock market continued its ascent (+3.5% in September, Russell 3000 index) and was influenced by a strong 3.8% GDP estimate for Q2, continued AI-spending deals being announced by large tech companies, and a lowering of the Federal Funds rate with the Fed considering more cuts by the end of the year. The leading asset class among U.S. stocks in September was large-cap growth stocks (+5.3%, Russell 1000 Growth index) as well as YTD (+17.2%). However, small-cap value stocks led the pack during the last three months (+12.6%, Russell 2000 Value index).
- International developed stock markets as measured by the MSCI World ex USA index gained during the month (+2.1%) despite the U.S. dollar appreciating slightly. The best performing asset classes last month within developed ex-U.S. stocks were small-cap stocks and small-cap value stocks (+2.2%, MSCI World ex USA Small Cap and Small Cap Value indices).
- On a YTD basis, the highest performing stock benchmark was international small-cap value, which gained +31.9% (MSCI World ex USA Small Cap Value NR USD) and has outpaced U.S. large-cap growth stocks (Russell 1000 Growth index) by +14.7% so far.
In fixed income (bonds):
- The Federal Reserve's rate setting body, the Federal Open Market Committee (FOMC), lowered the Federal Funds rate by 0.25% for the first time this year in their September meeting citing a softening labor market. A lowering of the Federal Funds rate, which the Fed controls, would lead to a lowering of yields in ultrashort maturity treasuries but will not directly influence treasuries of longer maturities (e.g., 10-year treasury yields). Market participants are expecting two additional rate cuts between now and the year's end, according to CME FedWatch.
- Bond returns in Treasuries were positive for all maturities last month as yields fell across most of the yield curve, with the exception of short-term inflation-protected treasuries (-0.2%, ICE BofA 1-5 Yr US Inflation Linked Treasury index).
- Corporate and municipal bonds were positive across all maturity segments. The Bloomberg U.S. Aggregate Bond Index was up +1.1% last month.
- Outside of the U.S., the Bloomberg Global Agg ex-US (hedged to USD) Index was up +0.5% last month.
- All bond segments continued to show positive performance over the trailing one- and three-year periods with the exception of long-dated treasuries.
Despite ongoing swings in the U.S. stock market and elevated geopolitical risks worldwide, a globally balanced 60/40 portfolio has gained +12.6%year-to-date. This underscores the value of diversification and the importance of staying focused on the factors within our control.
Thank you for reading. Please review our disclosures.
East Bay Investment Solutions, a Registered Investment Advisory firm, supplies investment research services under contract.
This document contains general information, may be based on authorities that are subject to change, and is not a substitute for professional advice or services. This document does not constitute tax, consulting, business, financial, investment, legal or other professional advice, and you should consult a qualified professional advisor before taking any action based on the information herein. This document is intended for the exclusive use of East Bay clients, and/or clients or prospective clients of the advisory firm for whom this analysis was prepared in conjunction with the EAST BAY TERMS OF USE, supplied under separate cover. Content is privileged and confidential. Information has been obtained by a variety of sources believed to be reliable though not independently verified. To the extent capital markets assumptions or projections are used, actual returns, volatility measures, correlation, and other statistics used will differ from assumptions. Historical and forecasted information does not include advisory fees, transaction fees, custody fees, taxes or any other expenses associated with investable products unless otherwise noted. Actual expenses will detract from performance. Past performance does not indicate future performance.
The sole purpose of this document is to inform, and it is not intended to be an offer or solicitation to purchase or sell any security, or investment or service. Investments mentioned in this document may not be suitable for investors. Before making any investment, each investor should carefully consider the risks associated with the investment and make a determination based on the investor’s own particular circumstances, that the investment is consistent with the investor’s investment objectives. Information in this document was prepared by East Bay Investment Solutions. Although information in this document has been obtained from sources believed to be reliable, East Bay Investment Solutions does not guarantee its accuracy, completeness, or reliability and are not responsible or liable for any direct, indirect or consequential losses from its use. Any such information may be incomplete or condensed and is subject to change without notice.
Visit eastbayis.com for more information regarding East Bay Investment Solutions.
East Bay Investment Solutions and Foundation Wealth & Tax Advisors are independent from and unaffiliated with each other; however, Foundation Wealth & Tax Advisors has engaged East Bay Investment Solutions to provide nondiscretionary investment portfolio recommendations to Foundation Wealth & Tax Advisors. Foundation Wealth & Tax Advisors, to the exclusion of East Bay Investment Solutions, retains the discretionary authority to accept or reject East Bay Investment Solutions’ investment portfolio recommendations with respect to its clients’ accounts.
This material contains general information, may be based on authorities that are subject to change, and is not a substitute for professional advice or services. This material does not constitute tax, consulting, business, financial, investment, legal or other professional advice, and you should consult a qualified professional advisor before taking any action based on the information herein. This material is confidential and intended for the exclusive use of clients or prospective clients of Foundation Wealth & Tax Advisors Information has been obtained from a variety of sources believed to be reliable though not independently verified. To the extent capital markets assumptions or projections are used, actual returns, volatilities and correlations will differ from assumptions. Historical and forecasted information does not include advisory fees, transaction fees, custody fees, taxes or any other expenses associated with investable products. Actual fees and expenses will detract from performance. Past performance does not indicate future performance.
The sole purpose of this material is to inform, and it is not intended to be an offer or solicitation to purchase or sell any security or other investment product. Investments mentioned in this material may not be suitable for all investors. Before making any investment, each investor should carefully consider the risks associated with the investment and make a determination based on the investor’s own particular circumstances, and carefully consider whether the investment is consistent with the investor’s investment objectives.
Information in this material was prepared by East Bay Investment Solutions. Although information in this material has been obtained from sources believed to be reliable, East Bay Investment Solutions does not guarantee its accuracy, completeness or reliability and is not responsible or liable for any direct, indirect or consequential losses from its use. Any such information may be incomplete or condensed and is subject to change without notice.
With benchmark descriptions: MSCI ACWI Index, MSCI’s flagship global equity index, is designed to represent performance of the full opportunity set of large- and mid-cap stocks across 23 developed and 24 emerging markets, covering approximately 85% of the free float-adjusted market capitalization in each market. Russell 3000 Index is a market-capitalization-weighted equity index that tracks the performance of the 3,000 largest U.S.-traded stocks which represent about 98% of all U.S incorporated equity securities. Standard & Poors 500 is an index based on the market capitalizations of 500 large companies having common stock listed on the NYSE or NASDAQ. The S&P 500 index components and their weightings are determined by S&P Dow Jones Indices. Russell 1000 Index is an index of approximately 1,000 of the largest companies and is a subset of the Russell 3000, comprising approximately 90% of total market capitalization of all listed US stocks. Russell 1000® Growth Index is a market capitalization weighted index that measures the performance of those Russell 1000® companies with higher price-to-book ratios and higher forecasted growth values. Russell 1000® Value Index is a large-cap value index measuring the performance of the largest 1,000 U.S. incorporated companies with lower price-to-book ratios and lower forecasted growth values. Russell 2000® Growth Index measures the performance of the Russell 2000 companies with higher price-to-book ratios and higher forecasted growth values. Russell 2000® Value Index is an unmanaged, market-value weighted, value-oriented index comprised of small stocks that have relatively low price-to-book ratios and lower forecasted growth values. MSCI World ex USA Index captures large and mid cap representation across developed market countries excluding the US. The MSCI World ex USA Value Index captures large and mid cap securities exhibiting overall value style characteristics across developed market countries excluding the US. MSCI World ex USA Small Cap Index captures small cap representation across developed market countries excluding the US. MSCI World ex USA Small Value Index captures small cap representation across developed market countries excluding the US emphasizing stocks with lower valuations. MSCI Emerging Markets Index captures large and mid cap representation across 24 Emerging Markets (EM) countries and covers approximately 85% of the free float-adjusted market capitalization in each country. Dow Jones Global Select REIT Index is designed to measure the performance of publicly traded REITs and REIT-like securities and is a sub-index of the Dow Jones Global Select Real Estate Securities Index (RESI), which seeks to measure equity real estate investment trusts (REITs) and real estate operating companies (REOCs) traded globally. The index is designed to serve as a proxy for direct real estate investment. Dow Jones U.S. Select REIT Index tracks the performance of publicly traded REITs and REIT-like securities and is designed to serve as a proxy for direct real estate investment, in part by excluding companies whose performance may be driven by factors other than the value of real estate. The index is a subset of the Dow Jones U.S. Select Real Estate Securities Index. Dow Jones Global ex-US Select REIT Index is designed to measure the performance of publicly traded REITs and REIT-like securities traded globally ex-US. ICE BofA 3-Month T-Bill Index is an unmanaged index that measures returns of three-month Treasury Bills. ICE BofA 1-5 Year US Treasury, Corporate and Municipal Indexes are subsets respectively of ICE BofA US Treasury, Corporate and Municipal Indexes including all securities with a remaining term to final maturity greater than or equal to 1 year and less than 5 years. ICE BofA 5-10 Year US Treasury, Corporate and Municipal Indexes are subsets respectively of ICE BofA US Treasury, Corporate and Municipal Indexes including all securities with a remaining term to final maturity greater than or equal to 5 years and less than 10 years. ICE BofA 10+ Year Treasury, Corporate and Municipal Securities Index are subsets respectively of ICE BofA US Treasury, Corporate and Municipal Securities Indexes including all securities with a remaining term to final maturity greater than or equal to 10 years. Bloomberg Global Aggregate Bond Index provides a broad-based measure of the global investment-grade fixed income markets (one version shown with its currency hedged back to the USD and is noted as such). Bloomberg Global Aggregate Bond Index ex-US provides a broad-based measure of the global ex-US investment-grade fixed income markets (shown with its currency hedged back to the USD). Bloomberg US Aggregate Bond Index is a broad-based flagship benchmark that measures the investment grade, US dollar-denominated, fixed-rate taxable bond market. The index includes Treasuries, government-related and corporate securities, MBS (agency fixed-rate and hybrid ARM pass-throughs), ABS and CMBS (agency and nonagency). ICE BofA US Inflation-Linked Treasury Index tracks the performance of U.S. dollar denominated inflation linked sovereign debt publicly issued by the U.S. government in its domestic market. Qualifying securities must have at least one year remaining term to final maturity and no more than 5 years to maturity. Bloomberg U.S. Corporate High Yield Bond Index is a total return performance benchmark for fixed income securities having a maximum quality rating of Ba1. 60% Russell 3000 and 40% Bloomberg US Aggregate Bond Index is a blended benchmark rebalanced on a monthly basis. 60% MSCI All Country World Net and 40% Bloomberg Global Aggregate hedged USD is a blended benchmark rebalanced on a monthly basis.

Subscribe to our Newsletter and Receive Important News & Updates.

Foundation Wealth & Tax Advisors is a Fee-Only, Fiduciary, Independent Financial Advisory Firm.
Check the background of your financial professional on FINRA's BrokerCheck.
The content is developed from sources believed to be providing accurate information. The information in this material is not intended as tax or legal advice. Please consult legal or tax professionals for specific information regarding your individual situation. The opinions expressed and material provided are for general information, and should not be considered a solicitation for the purchase or sale of any security.
We take protecting your data and privacy very seriously. As of January 1, 2020 the California Consumer Privacy Act (CCPA) suggests the following link as an extra measure to safeguard your data: Do not sell my personal information.